Fertiliser is the most important input foragricultural development in the country.Realizing the need of fertiliser to improve farmproductivity, Government of India enactedFertiliser (Control) Order (FCO) in 1957 toregulate quality, sale and price of fertilisers.Further, a comprehensive revised Order wasissued in 1985 in supersession of FCO 1957 knownas FCO 1985. Government also brought out aretention price scheme (RPS) for urea effectivefrom November 1977 and for complex fertilisersw.e.f. February 1979. The basic objective of thescheme was to make fertilisers available tofarmers at affordable MRPs by bearing thedifference in cost of manufacturing and the MRPsby the Government as subsidy and to ensureindigenous fertiliser manufacturers a reasonablereturn on their investments . Quite a largenumbers of plants came into existence in 1980s.However, the cost of production continued to beon rise and the MRPs of fertilisers were kept atthe same level. Therefore, there had beensubstantial increase in subsidy.
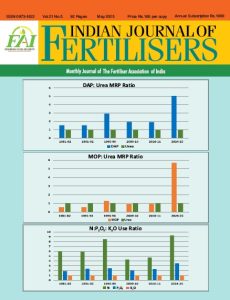
Government of India then formed a JointParliamentary Committee (JPC) on fertiliserpricing in 1991. On the basis of recommendationsof JPC, phosphatic and potassic (P&K) fertiliserswere decontrolled from 25 August 1992 andlater import was decanalized. As the cost ofproduction was to be borne by the farmers, thesteep increase in MRPs resulted in decline inconsumption of these fertilisers. It signifies thatprice elasticity of demand for fertilisers is verystrong among the farmers. MRP of DAP to ureadistorted to 2.41:1 and MOP to urea to 1.63:1 in1992-93, from the respective figures of 1.53:1 and0.56:1 in 1991-92. N:P2O5:K2O use ratio, whichwas 5.9:2.4:1 in 1991-92 got vitiated to 9.5:3.2:1in 1992-93. Realizing dwindling N:P2O5:K2O useratio, Government of India introduced ad-hocconcession from rabi 1992-93 itself followed byfixed MRPs from 1997-98 till 2009-10 by coveringthe cost of production/import through subsidy.MRPs on DAP varied from Rs. 8300 MT-1 to Rs.9350 MT-1 and MOP from Rs. 3700 MT-1 to Rs. 4455MT-1 during 1997-98 and 2009-10, as fixed by theGovernment. The same were the trends in MRPsof other P&K fertilisers. Corresponding figuresfor urea were Rs. 3660 MT-1 and Rs. 4830 MT-1. Asthe price ratios of DAP to urea and MOP to ureawere fairly good at 1.94:1 and 0.92:1, respectivelyin 2009-10, N:P2O5:K2O translated to reasonablelevel of 4.3:2.0:1.
To bring reforms in the sector, Government ofIndia introduced nutrient based subsidy (NBS)policy on P&K fertilisers from 1 April 2010. Underthe policy, subsidy on per kg of nutrient was fixedand MRPs were made market driven. Urea,constituting more than 50% of the fertiliserproducts consumed in the country, was kept outof the ambit of NBS policy. No doubt, MRP of ureawas enhanced by 10% from 1 April 2010,however, MRP continues to remain a depressedprice, thus encouraging farmers to make use ofmore urea at the cost of P&K fertilisers. Theindustry was allowed to increase MRP of DAPfrom Rs. 9,350 MT-1 in 2009-10 to Rs. 9,950 MT-1during April-December 2010 and Rs. 10,750 MT-1for January-March 2011. In view of decline insubsidy component afterwards of 2010-11, therehad been increase in MRPs of P&K fertilisers tocover the cost of production/import. For example,subsidy on DAP declined from Rs.16,268 MT-1 in2010-11 to Rs. 10,231 MT-1 in 2020-21.
From 2021-22, the Department of Fertilizers (DoF)enhanced the NBS rates on P2O5 component fromRs. 14.888 kg-1 in 2020-21 to Rs. 45.323 kg-1 in2021-22. The Department directed the companiesto have a fixed MRP of Rs. 1,200 per 50 kg bag ofDAP for 2021-22. MRP of DAP is now at Rs. 1,350per 50 kg bag. The same is the case for other NPs/NPKs. The DoF started announcing NBS rates ofnutrients on quarterly basis in 2022-23 lookingto the trend of prices in the international market.To insulate the farmers from any hike in prices of finished fertiliser products and raw materials inthe international market in view of conflicts anddisruptions and to make these fertilisersavailable to farmers at affordable MRPs, theGovernment of India came to the rescue byenhancing the subsidy during 2021-22 and 2022-23. It may not be out of place to highlight thatsubsidy ratio of P&K fertilisers to urea had comedown from 1.61:1 in 2009-10 to 0.44:1 in 2024-25,signifying considerable contribution of P&Kfertilisers in saving subsidy outgo of theGovernment, but at what cost? There has beenincrease in subsidy on urea by 4.84 times andonly 1.33 times on P&K fertilisers from 2009-10to 2024-25. There was only 10% increase in MRPof urea effective from 1 April 2010. However, therehas not been any increase in MRP of urea sincethen, except an increase of Rs. 50 MT-1 from 1November 2012 on account of acknowledgementof receipt of fertilisers through point of salemachines by the retailers. MRP ratio of DAP tourea and MOP to urea was 5.04:1 and 5.69:1,respectively in 2024-25. Considerable reductionin subsidy on MOP, is affecting its consumption,which is vital for plant metabolism. The result iswidening of N:P2O5:K2O use ratio over the yearsin NBS regime and it was 9.3:3.5:1 in 2024-25.
From the above discussions, it emerges thatwidening N:P2O5:K2O use ratio i.e. imbalance inuse of nutrients is a cause of concern. One of themajor reasons for such widening ratio is themammoth disparity in MRPs of P&K fertiliserswith respect to urea.
The crop response to fertiliser application andsoil health are on decline. It is not exaggeratingto underscore that fertilisers are plant food andcontain essential nutrients in ionic forms, whichare to be absorbed by the plants. Average use offertiliser in terms of nutrients was 150 kg ha-1 in2023-24. There are many countries world over,where consumption of nutrients throughfertilisers has been noticeably high compared to India and so is the case of average yields of crops.In the country, there are inter state and intercropvariations in use pattern of fertilisers. Per haconsumption of fertiliser nutrients varies fromless than 1 kg in Nagaland to 255 kg in AndhraPradesh. There are certain states in whichN:P2O5:K2O use ratio is quite wide. More impetusis required in the states where fertiliserconsumption is low to enhance consumption andimprove the use ratio where it is more in favourof N. Increase in compound annual growth ratein productivity of rice and wheat from 2009-10to 2023-24 works out to be only 2.2 and 1.6%,respectively. There is no scope in expansion ofcultivated area. Further increase in agriculturalproduction will only be possible throughenhancement in average yields of crops. It is wellproved under long-term fertiliser experimentsconducted at Research Institutes of IndianCouncil of Agricultural Research, AgriculturalUniversities and other concerned thatapplication of P and K along with N in balancedproportion contributes to enhancing crop yields,improving nutrient use efficiency & soil healthand bringing better returns to farmers. Use ofsecondary- and micro-nutrients will have addedadvantages wherever deficiencies are observed.The Industry has been responsibly catering to theneed of the farmers to make fertilisers availableto them across the country by indigenousproduction/import and logistics planning.Industry is making efforts for development anduse of innovative fertilisers having betternutrient use efficiency. However, a judicious andwell-calibrated approach is imperative torationalize fertiliser application, therebyoptimizing resource utilisation and ensuringmaximum benefit to farmers.
In conclusion, it has to be underlined that subsidyon urea needs to be brought down and subsidysaving on this account should be provided to P&Kfertilisers to maintain appropriate balancebetween the MRPs of urea and P&K fertilisers forthe farmers enabling them to apply fertilisers inbalanced proportion. Further, bringing ureaunder domain of NBS policy will promotebalanced fertilisation. Implementation of directbenefit transfer of subsidy in the bank account ofthe farmers in true sense will give freedom to thefarmers to choose products in line with thebalanced nutrient application.